I built an interactive IPL dashboard using Python and Streamlit, which allows users to analyze player performance, team stats, and match outcomes through filters and visual insights.
View Project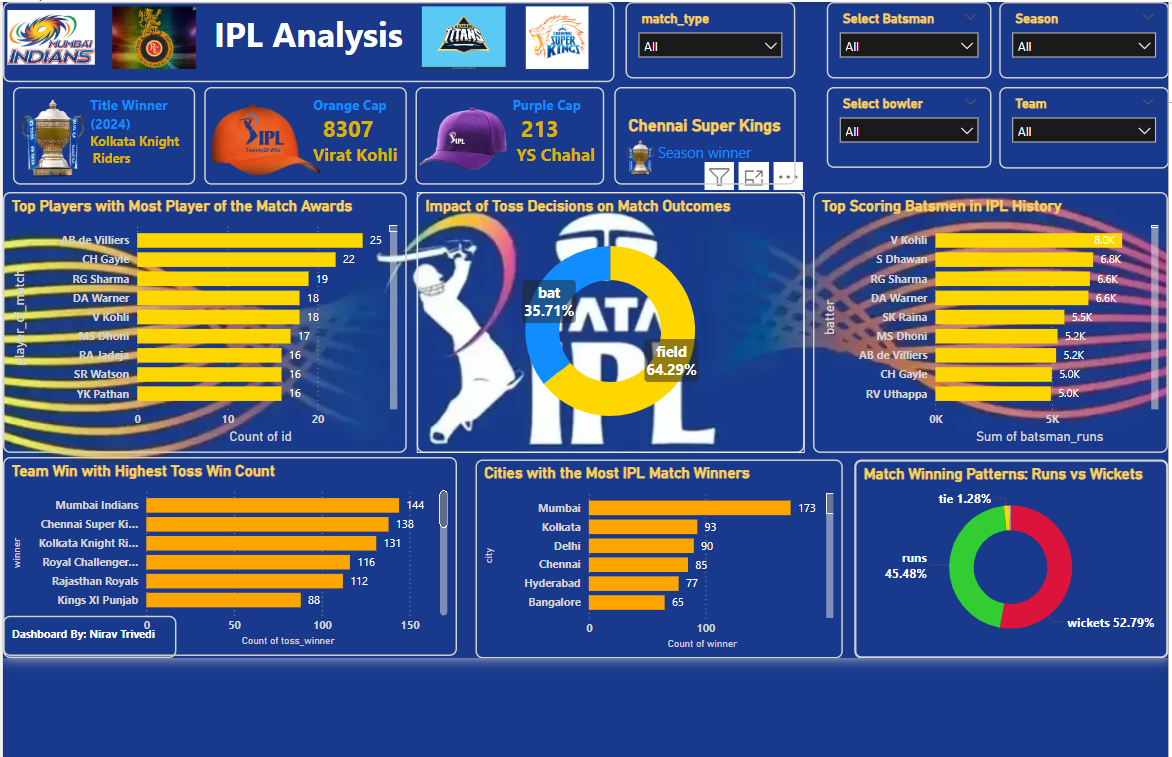
This project analyzes Indian mutual fund performance to identify low-risk, high-confidence investment options using Python data analysis and Power BI visual dashboards.
View Project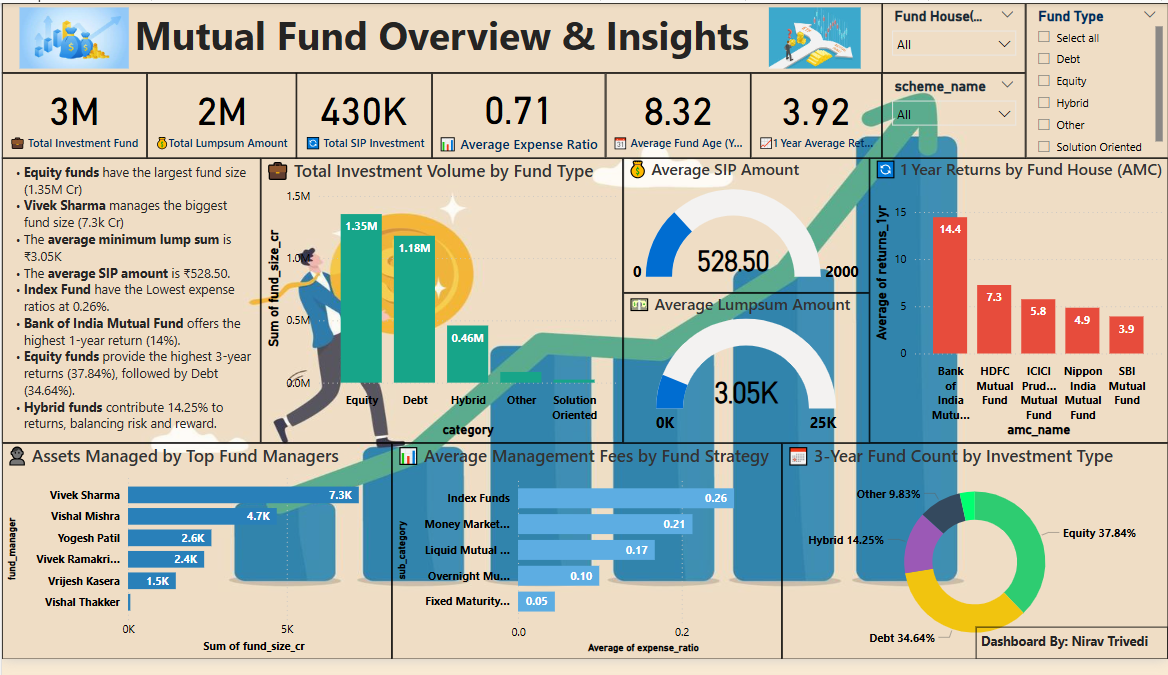
This academic project assesses the sustainability of Surat’s Tapi River using satellite data from 1987 to 2023, focusing on turbidity trends and cumulative width changes over the years.
View ProjectTurbidity of Tapi River (2019–2023)
Changes in Tapi River Width (1987–2023)

This project explores the IMDb Top 250 Indian movies dataset, analyzing top directors, genre distribution, review trends, and award-winning titles using Python and Power BI.
View Project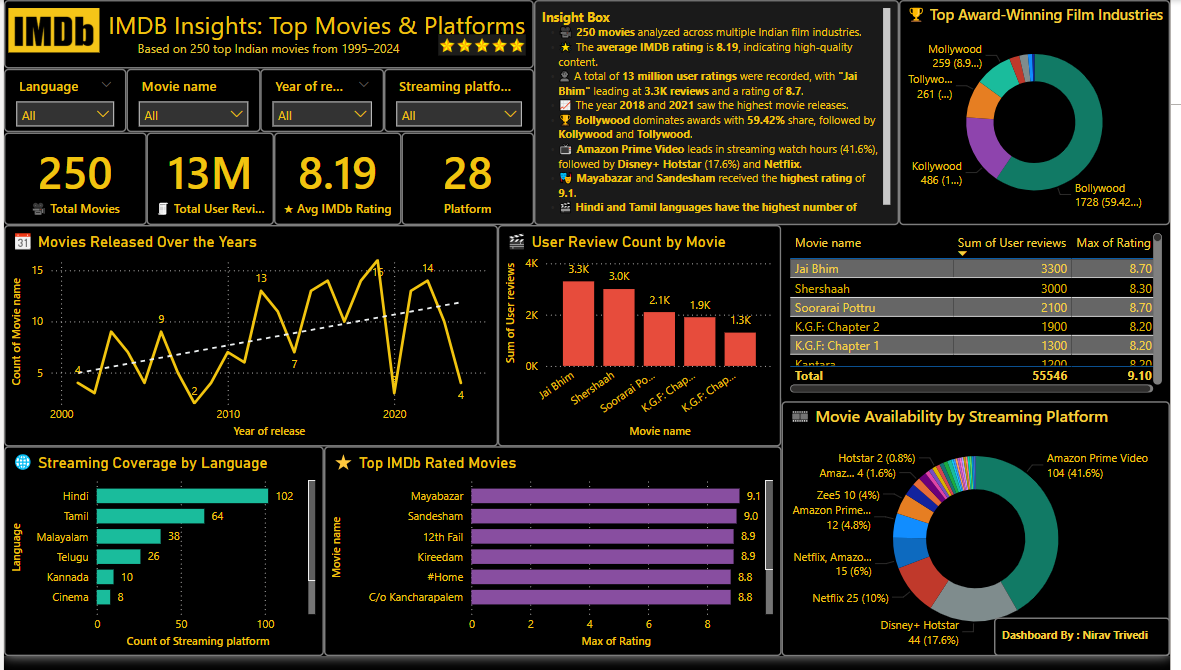
I performed analysis of 353+ Indian TV Serials (1889–2025) using Python with K-Means clustering (Unsupervised Learning) to identify patterns across networks, languages, and genres. Designed an interactive Power BI dashboard with KPIs, filters, and trend analysis.
View Project
This interactive Power BI dashboard analyzes 3,400+ web series released between 2000–2024 across 42 countries and 96 industries.It highlights OTT trends, global release patterns, top-rated shows, language contributions (English, Hindi, Japanese),and audience preferences with 70M+ votes. A must-see project for exploring OTT analytics and global web series insights.
View Project
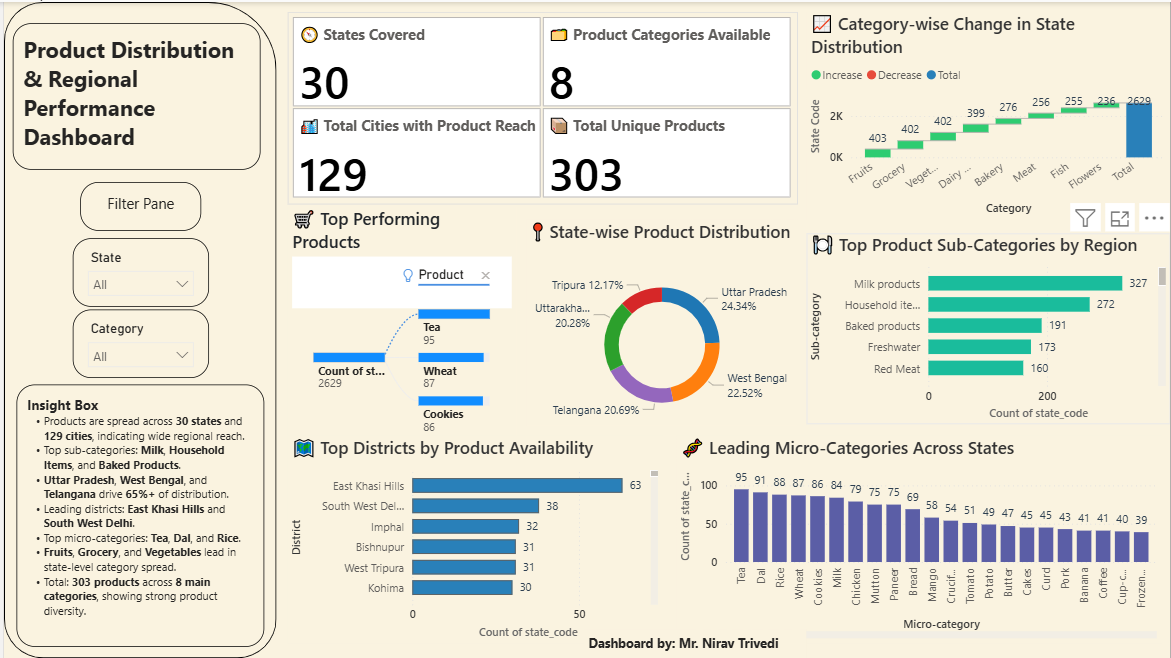
This project analyzes state-wise product demand across India using Python-based exploratory analysis and K-Means clustering to identify regional consumption behavior and high-potential markets.The analytical results were translated into a Power BI dashboard that enables clear state-wise comparisons, product category contribution analysis, and supports data-driven inventory and regional planning decisions.
View Project